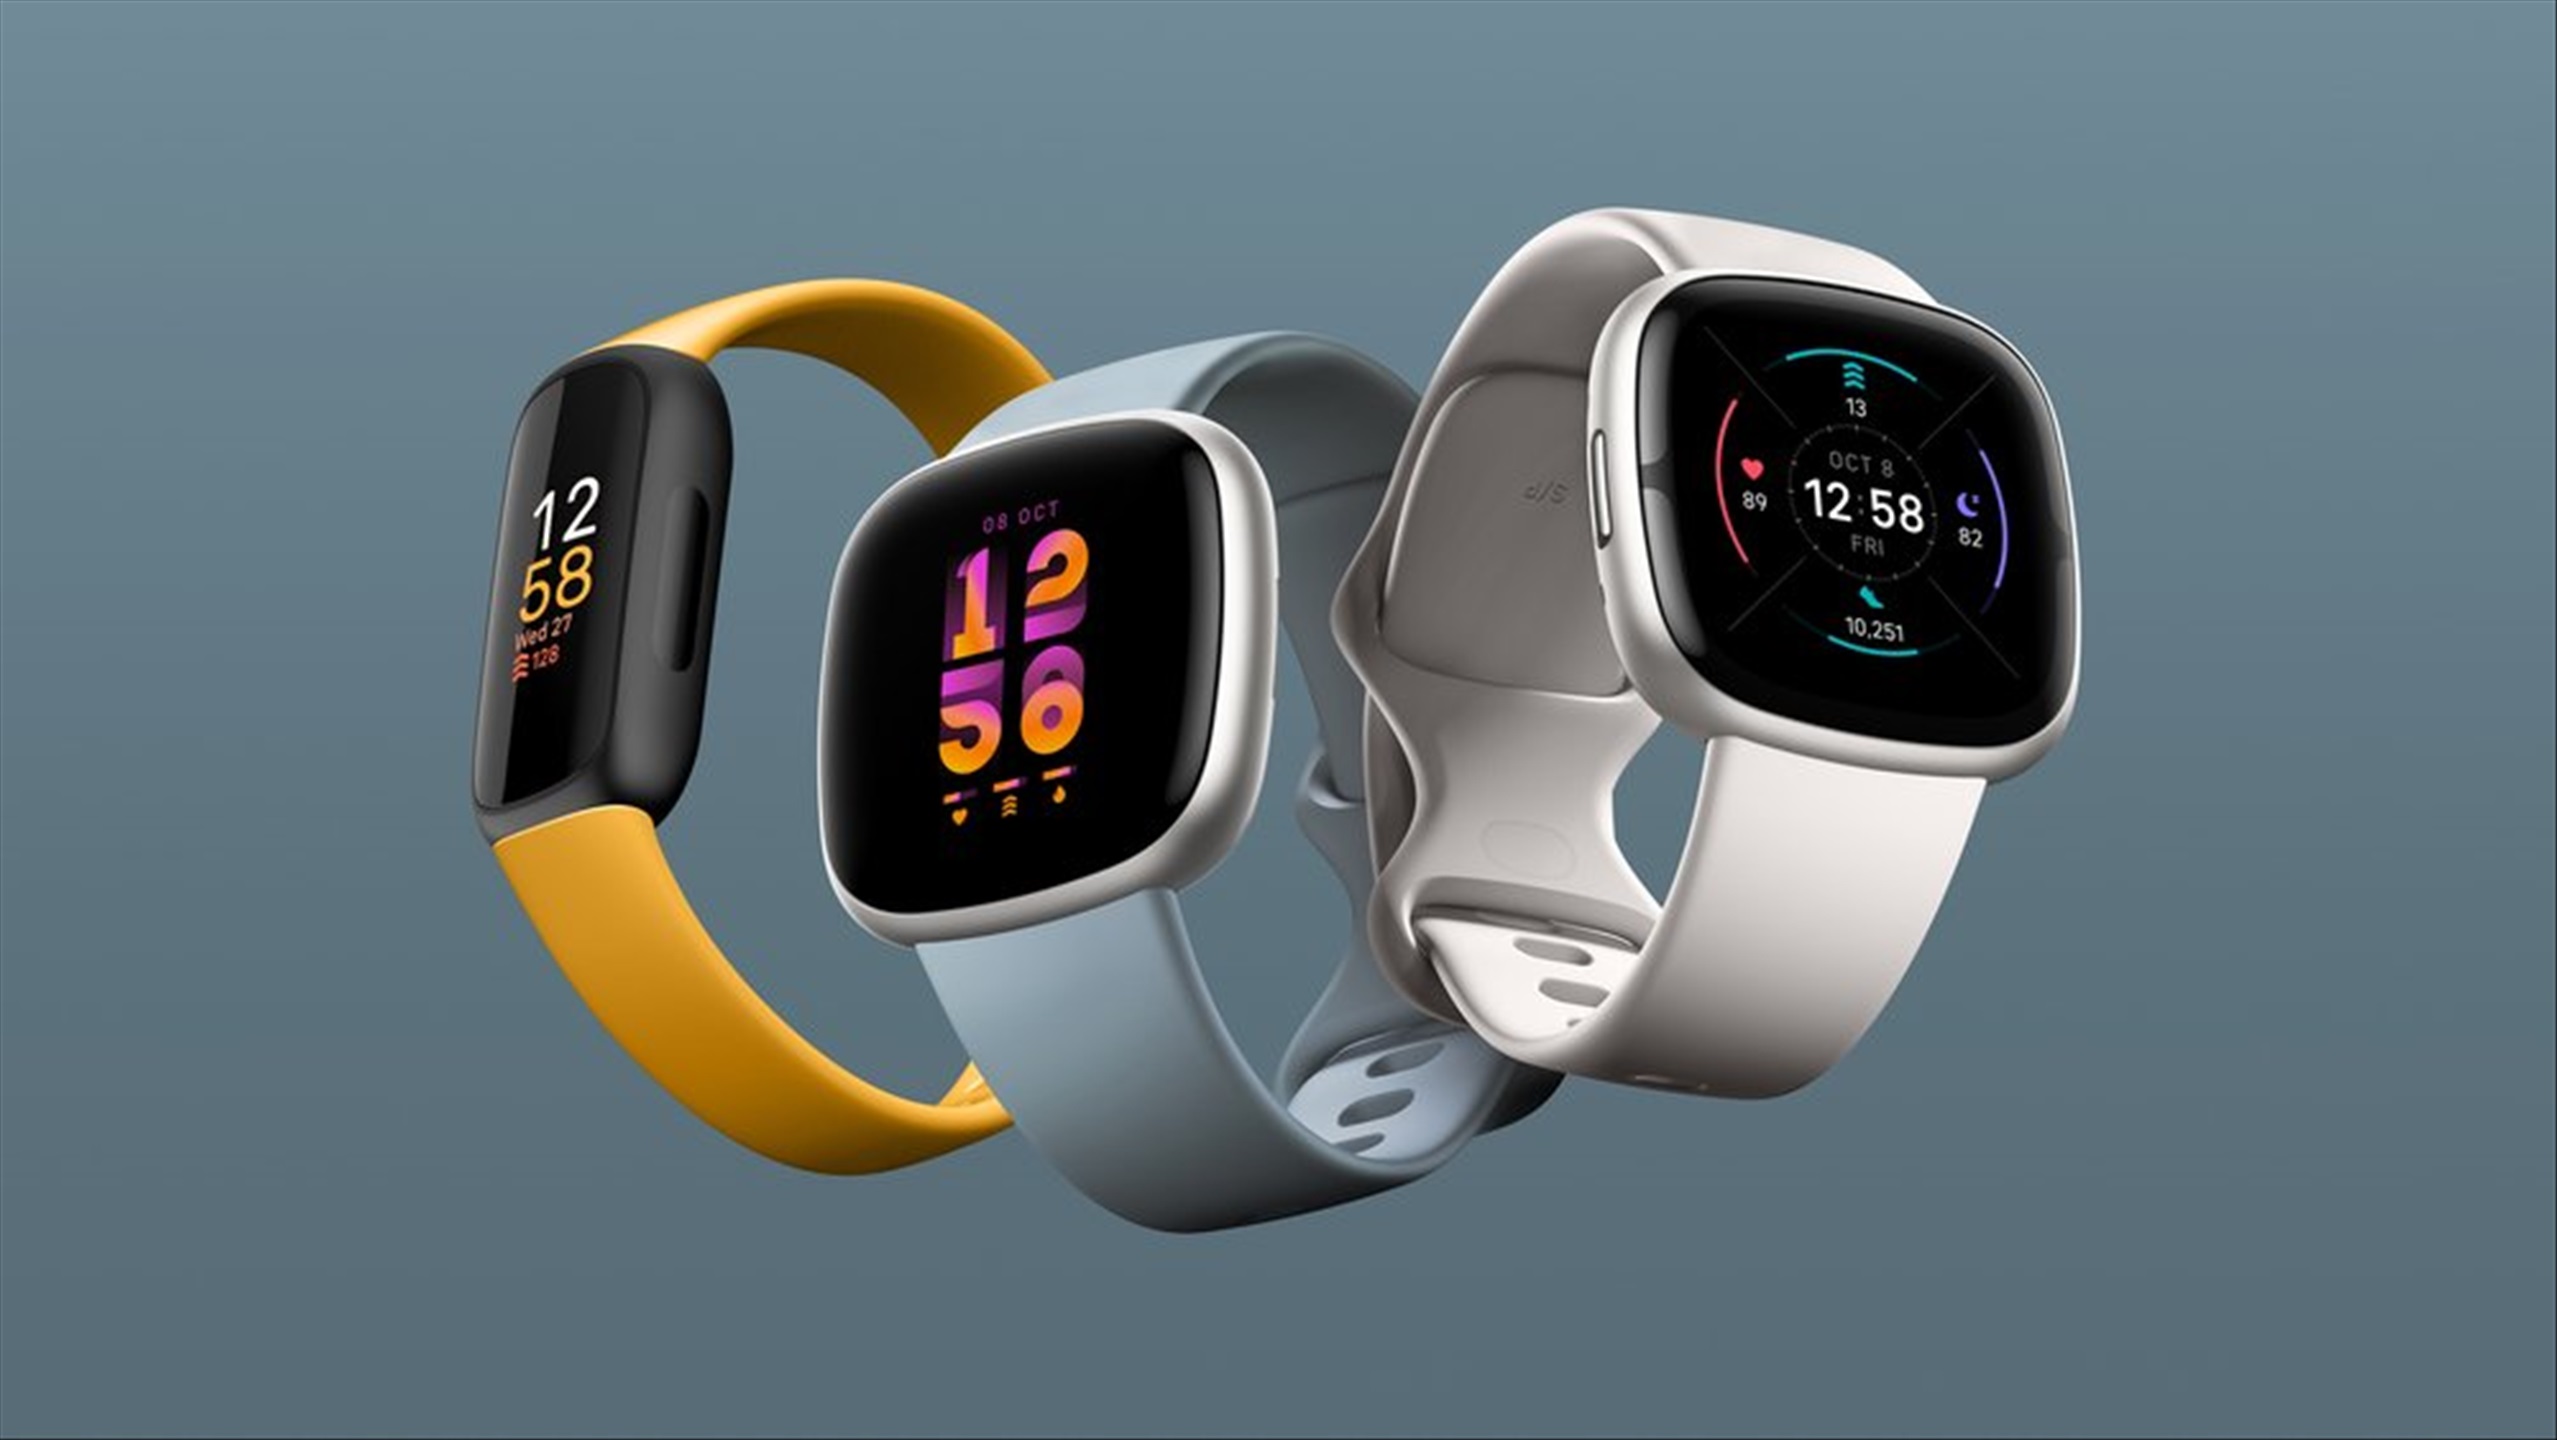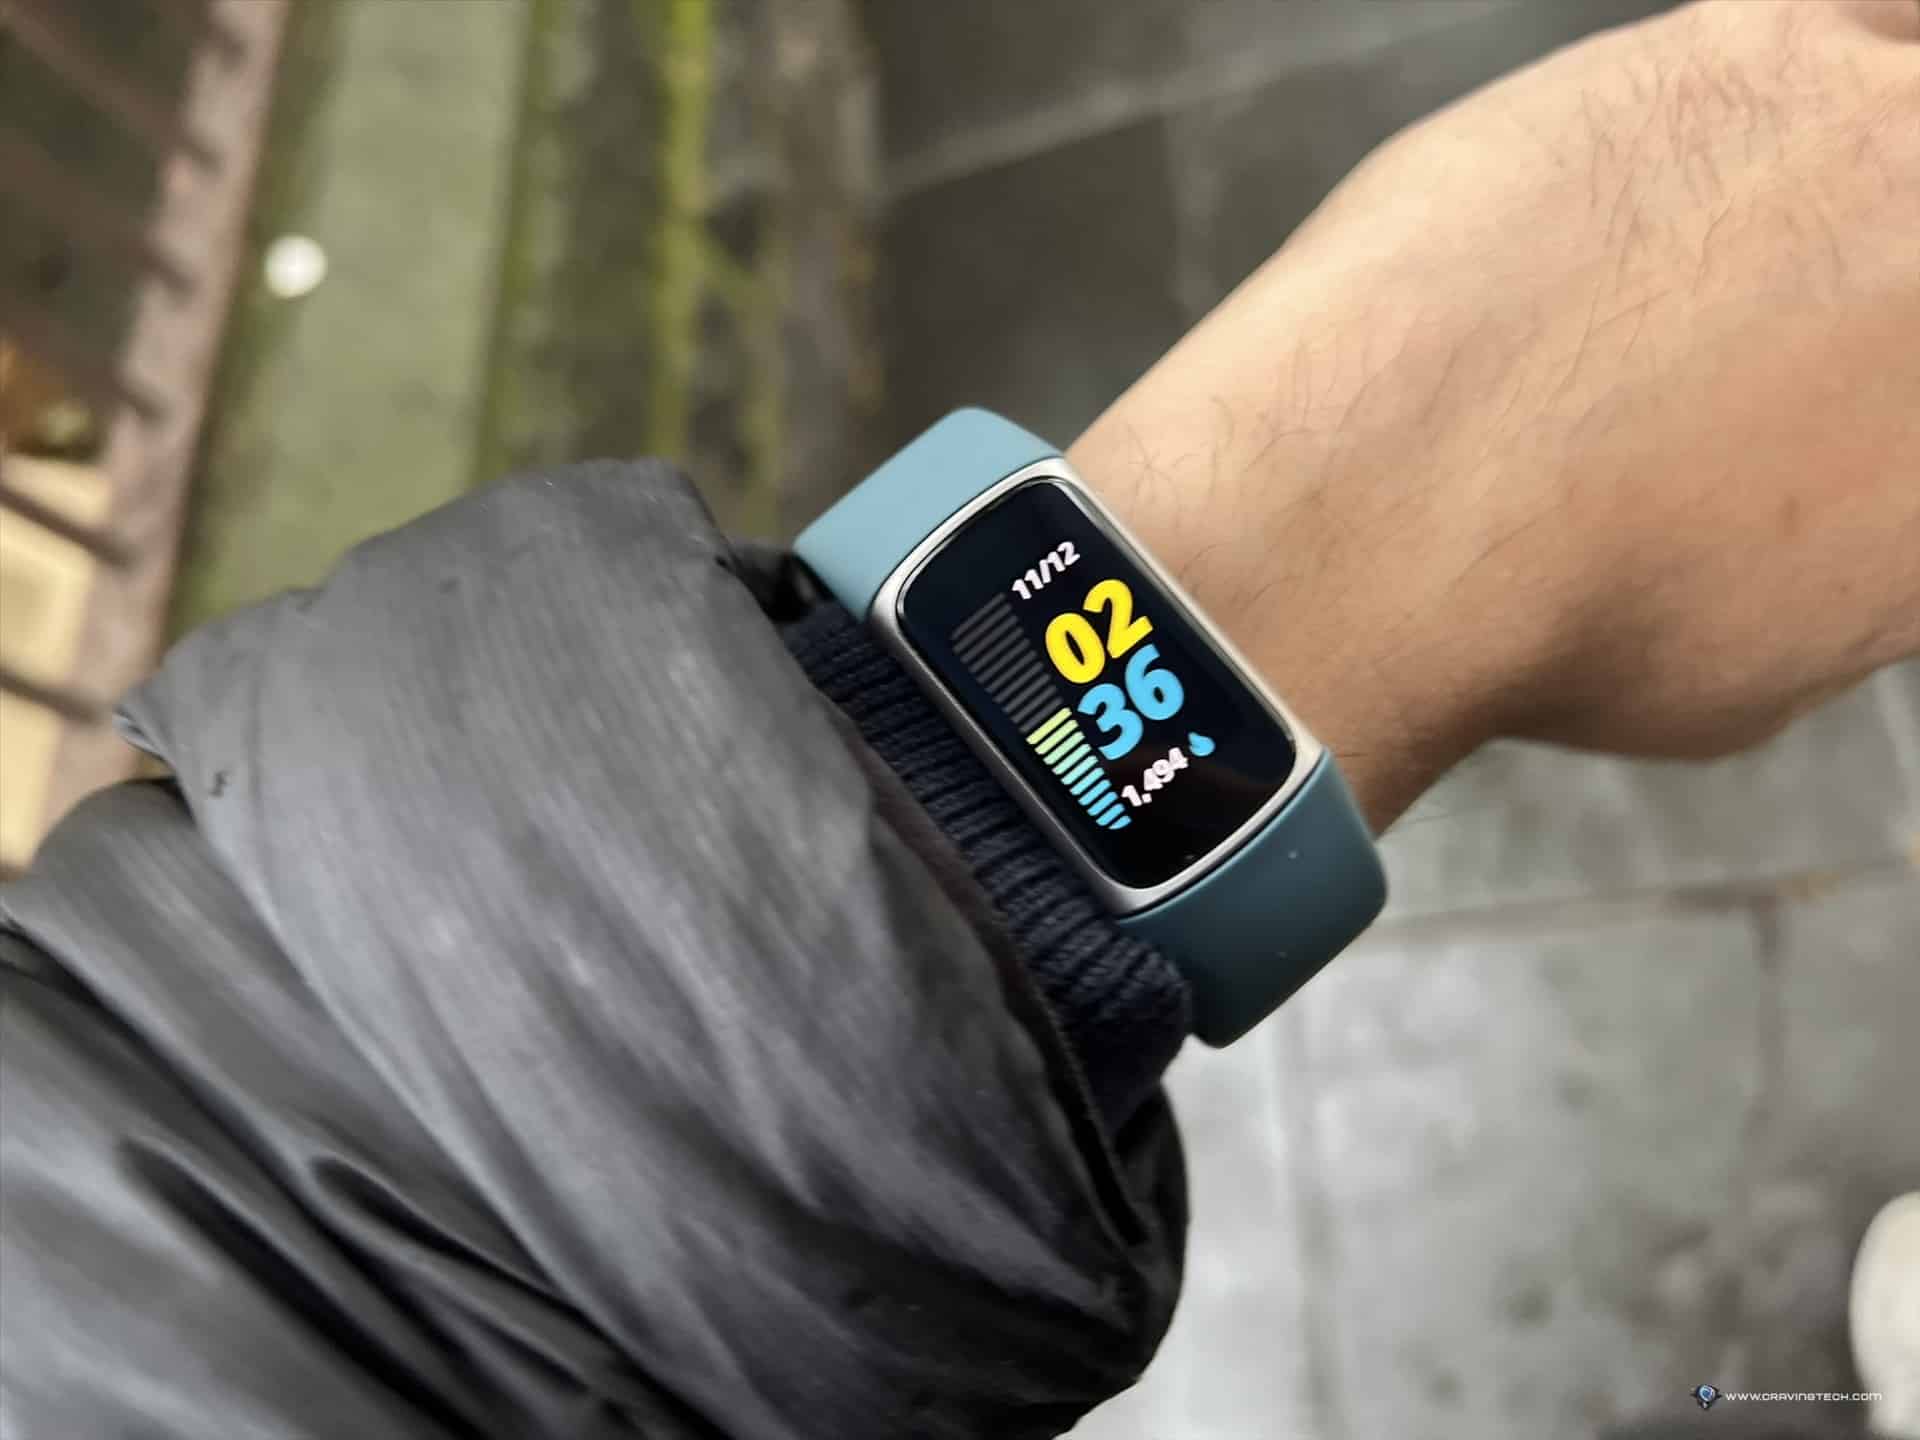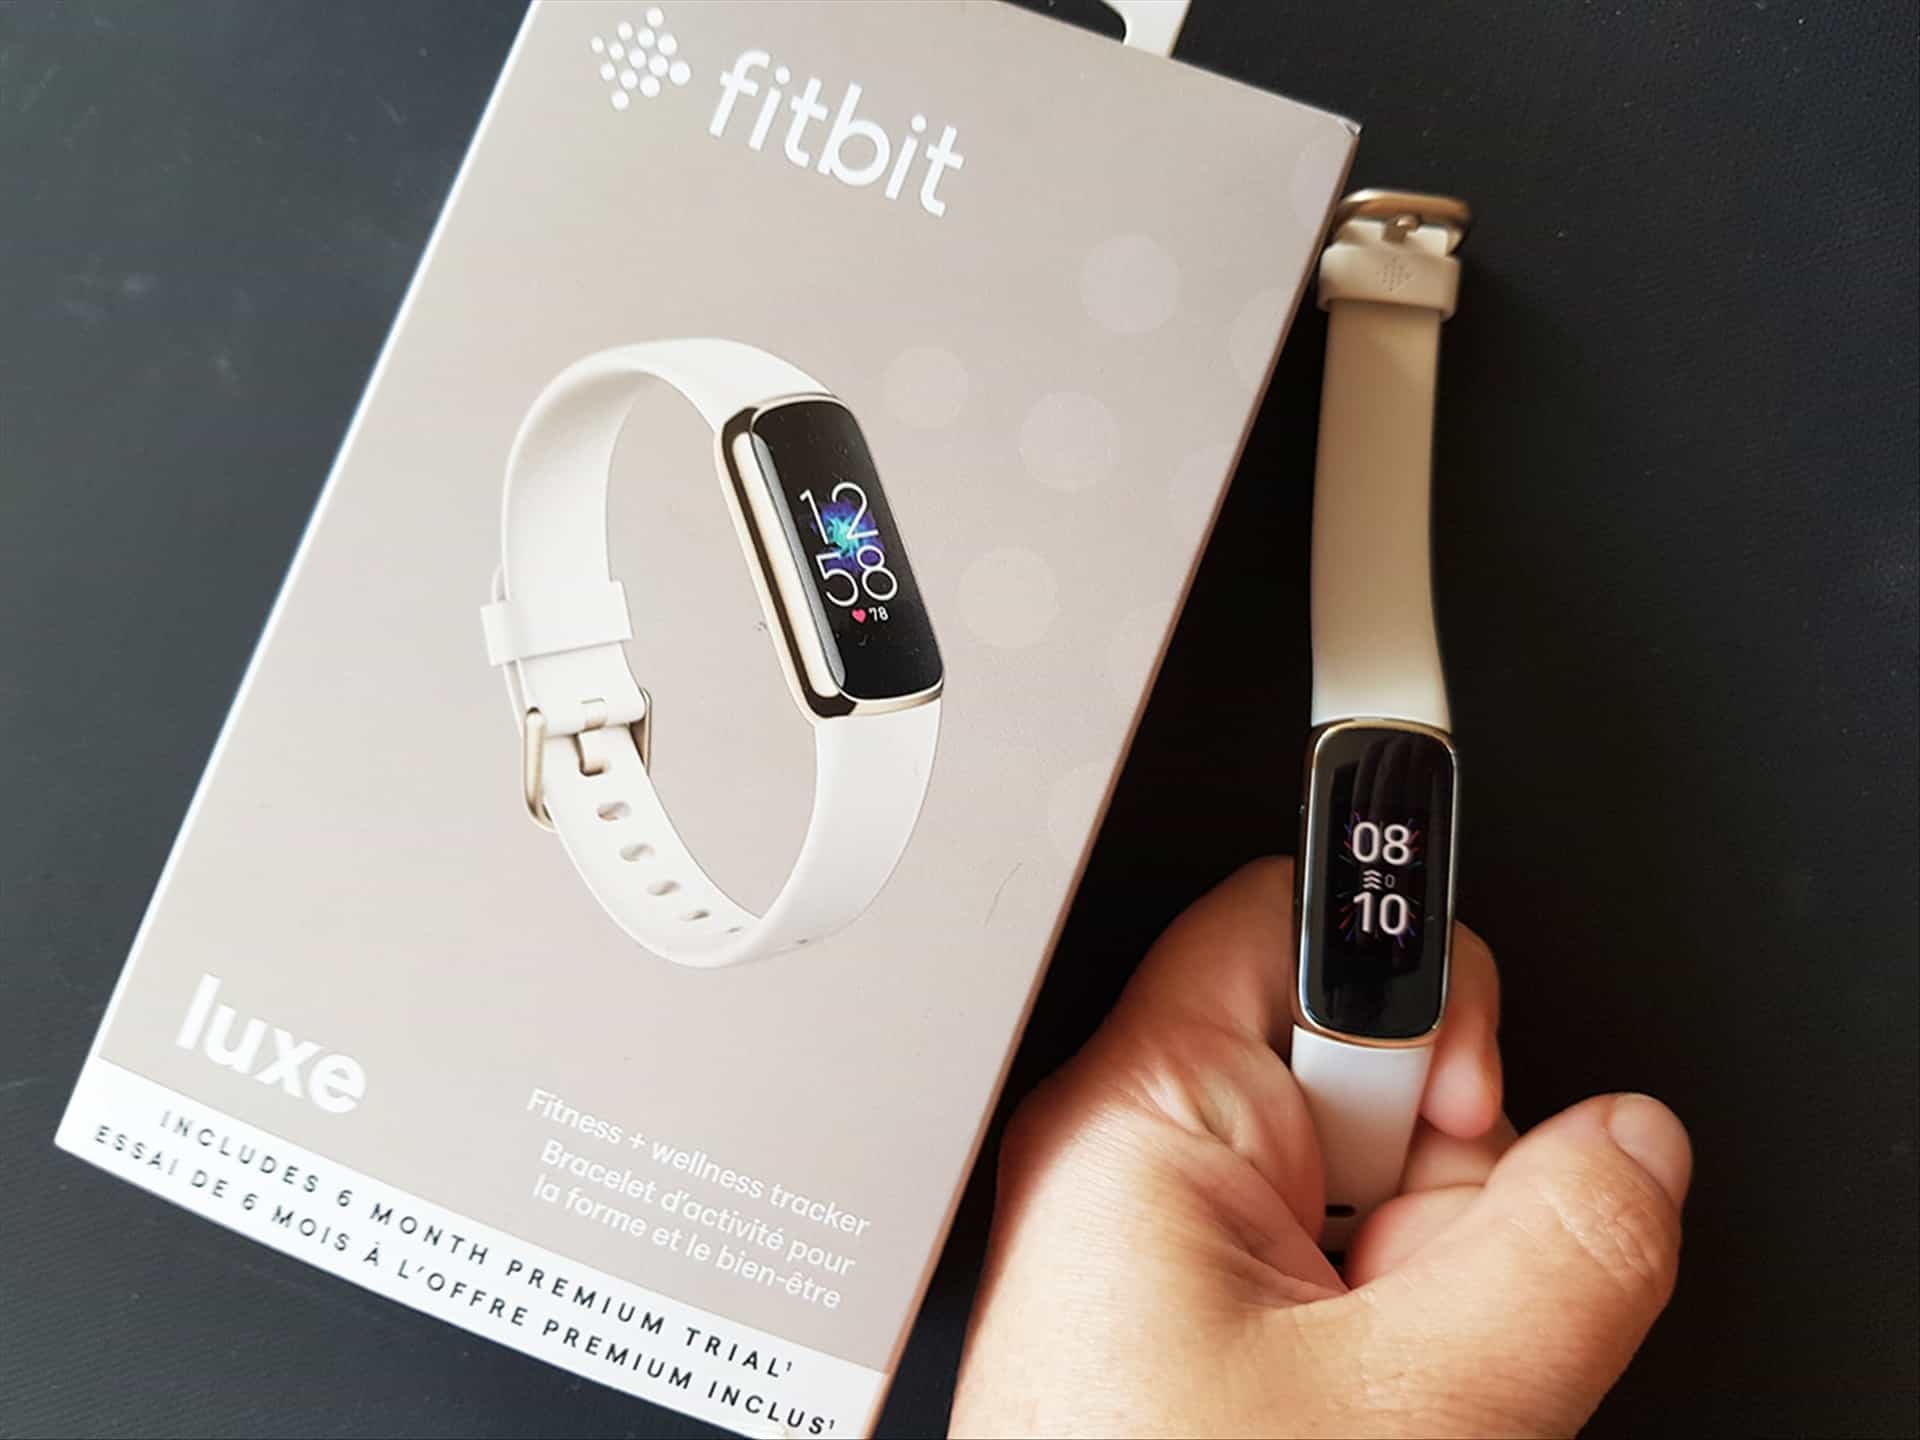
If you own a Fitbit Charge 3, Ionic, Versa, Versa Lite, or Versa 2 (check our reviews if you haven’t), you can now see Fitbit’s new stat: Estimated Oxygen Variation graph.
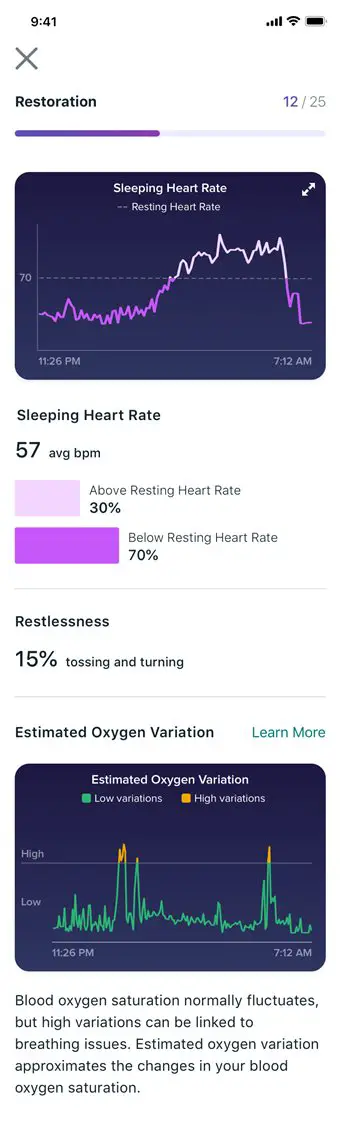
The feature was originally announced last year and will utilise the sensors on the back of the device to estimate the variability in your blood oxygen saturation level when you sleep.
Blood normally carries your oxygen and usually measured at 95-100%, i.e your blood is carrying as much oxygen as it can. When you stop breathing or have lung issues, these numbers will fall as less oxygen is being carried into your body. When a big variation is detected, it shows that something is happening to your health and you might have experienced breathing disturbances while you sleep, a.k.a sleep apnea.
The graph can help out in detecting these problems at the early stage, so you can follow it up. I myself have a borderline sleep apnea and I found this out from my dentist, because it looked like I’ve been grinding my teeth while I sleep. This is caused by my body reacting automatically, trying to grab a gasp of air while my breathing stops temporarily.
Make sure to check if your Fitbit app has an update and check the new stats out.