
Note: This is a guest post written by Edward Thomson
If you have been deploying your applications in different environments, you have probably heard the phrase, “But it works on my machine” multiple times, referring to how deployments and operations differ from system to system. Containerization aims to avoid that with portability.
Using a container orchestrator like Kubernetes lets you accomplish more. With Kubernetes, you can easily manage containers and automate complete processes for testing, scaling, and upgrading your application.
Although Kubernetes is only a few years old, the adoption of Kubernetes as a standard technology for managing containers has grown a lot in the last couple of years. A survey from the Cloud Native Computing Foundation from 2020 states that Kubernetes use in production increased only by 5%, but the number of developers using it increased 300% in about four years.
It is vital to gain experience working with containers and Kubernetes. It will give you a better global picture of how your application will function as you plan for scalability and failover measures. And as you start working with Kubernetes, one mishap you will encounter is pod crashing.
In this article, we briefly explain what Kubernetes is and describe one of its building blocks: the Kubernetes pod. We will then provide five common reasons that might cause your Kubernetes pod to crash.
What is Kubernetes, and What is a Kubernetes Pod?
Kubernetes is a software tool that lets you automate the deploying, scaling, and maintaining of applications running in containers.
Although Kubernetes can work with other containerization technologies, most developers use Docker containers as the two softwares have the most mindshare, and Kubernetes has put much more effort into perfecting its integration with Docker.
In Kubernetes, a pod is the smallest object. A pod is a group or set of running containers on your cluster. And in turn, a cluster is a set of nodes or worker machines that run containerized applications.
Reasons Your Kubernetes Pod Can Crash
A pod can crash under several circumstances:
1. The Application inside the Container Keeps Crashing
Kubernetes lets you configure replica sets for groups of containers running the same image.
Images in a replica set will be restarted automatically by Kubernetes according to a schedule.
This replication can be used for things like higher availability.
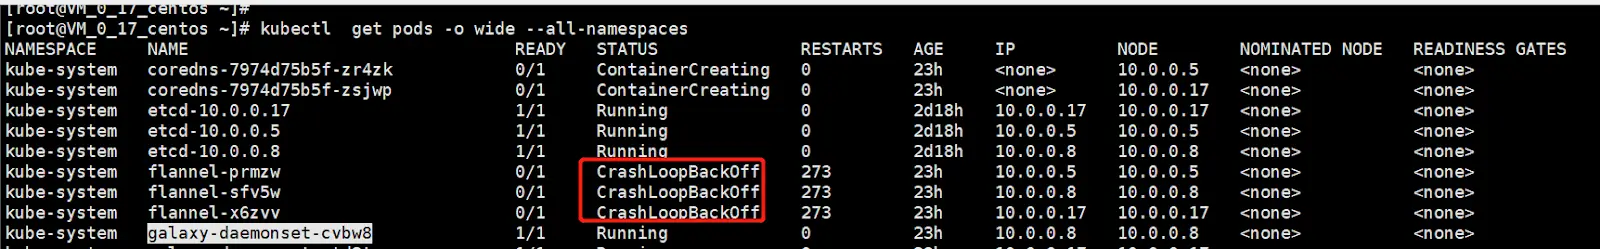
If the application (not the pod) has a critical error, it will run for a while and then crash.
When the application crashes, Kubernetes will spin up another container. But since the pod was not the issue, the application will crash again. Kubernetes will restart the container again after waiting an amount of time. This waiting period is increased every time the image is restarted. This cycle is referred to as a Crashloopbackoff error, and it’s a common one.
2. The Liveness Check Probe Failed
Kubernetes provides an API that can be used to monitor the current status of your pods using two probes: the Liveness Check Probe and the Readiness Probe. You can configure when the probes should start, how often they should run, and, most importantly, how many times a probe can fail before Kubernetes discontinues it and takes action.
In the event of a Liveness Check probe failure, Kubernetes restarts the container.
3. The Readiness Probe Failed
This is similar to the case described above. But in this case, the probe is checking if the pod is
ready to serve traffic requests.
In the event of a Readiness Probe failure, Kubernetes will stop sending traffic to the container instead of restarting the pod.
4. There is an Out of Memory Event
When your application crashes, that can cause a memory leak in the node where the Kubernetes pod is running.
Upon restarting, the amount of available memory is less than before and can eventually lead to another crash.
Along with the crash loop mentioned before, you’ll encounter an Out of Memory (OOM) event.
This severely impacts your application because Kubernetes will dispatch an OOM killer process to find a container with the highest memory consumption and terminate it.
5. A Value is Not Configured Properly
Such an occurrence might result in an ImagePullRequest error. This means Kubernetes failed to retrieve the image for the container. Since the image is not running, it may affect your whole application, making it unusable.
This error is likely to happen under 3 circumstances:
a. The image name provided in the pod specification is invalid.
b. the “tag” provided with the image name is invalid (ej. :v1.42.0).
c. the image specified is stored in a private registry (not Dockerhub, which is public).
Make sure you’re providing the correct values. Docker Hub lists all the available tags for each image.
Also, make sure you are using the right credentials when using a private registry.
Finding Out Why a Pod Crashed
There are many levels of technologies in such a deployment. Start with Kubernetes and work your way down to find your problem.
Kubernetes has a command-line tool, kubectl, with more than 40 operations to control your clusters. This tool will help you start the debugging process to find out why your pod crashed. While we are not covering debugging in detail here, we are listing the operations that you are likely to use more frequently.
You use kubectl to view information on your resources, such as pods and replication controllers.
Here are some examples:
- List all pods: $ kubectl get pods.
- Display the details of the pod with name <pod-name>: $ kubectl describe pods/<pod-name>.
- Describe all pods: $ kubectl describe pods.
- Display the details of the node with the name <node-name>: $ kubectl describe nodes <node-name>.
- List all replication controllers and services together: $ kubectl get replicationcontroller,services <replication-ctrl name>.
- Return a snapshot of the logs from pod <pod-name>: $ kubectl logs <pod-name>.
- View logs from pod <pod-name> as they happen: $ kubectl logs -f <pod-name>.
- Display Resource (CPU/Memory/Storage) usage: $ kubectl top.
Some kubectl commands related to containers are similar to Docker commands. But the Docker commands give you more information in some cases, so they are important when investigating at the container level. For example, “docker ps -a” also lists container IDs, commands being executed, and tcp/ip ports in use. Also, you will resort to Linux tools that you are familiar with to show the status of processes and log files.
Make sure you also keep an eye on your Kubernetes alerts, as they may help you diagnose any potential problems before they affect the execution cycle.
Conclusion
Kubernetes is a tool for container managers in a cluster. The advantage of developing complex and large applications using Kubernetes and containers is that smaller groups of developers can update and scale their functions independently of each other.
The smallest unit in Kubernetes is a pod, which represents a set of running containers on your cluster. But pods can crash for a number of reasons. We have talked about some of the common problems, like memory leaks and applications errors.
At first, finding the right reason for a pod crash might seem difficult, but the more experience you get, the easier it will be to find the reason for a crash.
If you want to build a career in Kubernetes, there are training courses and certifications available. You can enroll in courses provided by the Linux Foundation. Kubernetes offers three official certifications: Application Developer (CKAD), Administrator (CKA), and Security Specialist Program (CKS).