Content is king, according to many specialists, but more than that, visuals are starting to rise above the ranks.
According to data posted from an infographic posted on QuickSprout, content that utilizes images in some way tends to have at least 94 percent more views than any content that does not come with visuals.
That is quite a large number, and while this may be more applicable to social media sharing habits, this can also say a lot about how images can work to your advantage when presenting to a client or trying to train your staff.
If you have a lot of data that you need to present to any audience and want to make sure that they remember what you had to say, then read on to get a few tips and tricks on how you can present them in a much more visually engaging way.
- Use Images that Complement Your Information
Instead of relying only on text and numbers, you could really push your message by using images. After all, people will have to make the connection between the words you’re saying or presenting and the image you want them to see, so why not just show them? Think of the mantra many writers tell each other: “show, don’t tell.”

One of the masters of this type of presentation method was Steve Jobs, who would often show photos of only his products on screen while speaking about its many features and how it would change the world.
One specific example was when he was showing off the many things that the then new iPhone could do. But he didn’t reveal the iPhone immediately. Instead, he presented what appeared to be three new devices: a widescreen iPod with touch controls, a revolutionary mobile phone, a breakthrough internet communications device, and then revealed that these were not three separate gadgets, but all features that were rolled into one product.

- Try Using an Infographic to Present Your Data
If you have been on the internet in the past few years, then you have most likely run across at least one of these lately. Infographics, a combination of the words “information” and “graphics,” are exactly what they say on the tin: graphics that present information.
However not all infographics are compelling, especially if they dump information on the viewer rather than present it in a way that makes better sense and great use of the elements of design.
Plus, according to an article by Jenny Pieratt for the site Piktochart, infographics can drive deeper learning due to many benefits it can offer. They can do this by helping learners develop their visual literary, that is, identifying symbols and other elements that can represent any one concept or idea.
- Convert Your Statistics into a Creative Kinetic Video
Videos are even more engaging, since the addition of motion and time can allow you to add more meaning to your content. In fact, social media networks like Facebook are jumping on the trend, allowing videos to run automatically on people’s feeds to instantly grab their attention.
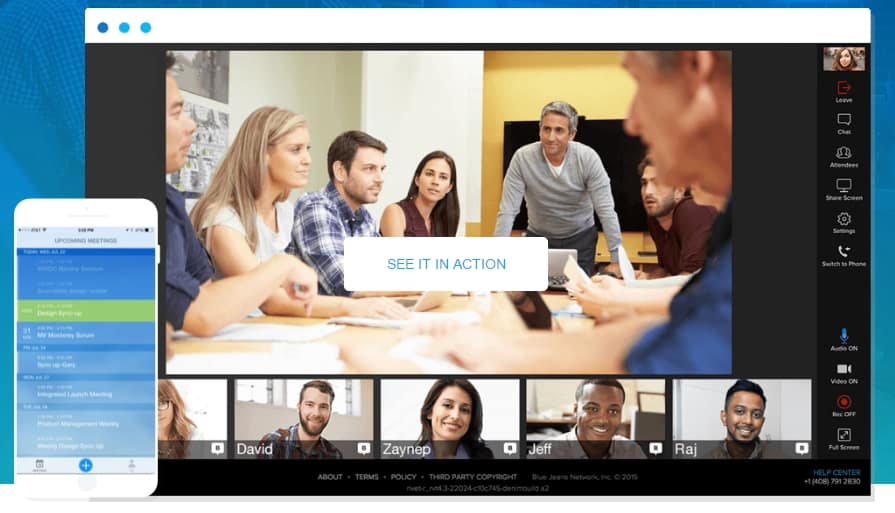
Businesses are seeing much more engagement by using them for marketing, too. You could even go the extra mile and hold a meeting with tons of digital supplementary content using BlueJeans data video communications to drive your point across.
With the added benefit of being able to see the person speaking, your audience can connect with you on a much deeper level by examining your facial expressions as well as your body language.
- Use Charts, Graphs, and Tables, but Only if Necessary
These are all features that come in standard editions of most computer office software, but they can really come in hand if you really need to come up with graphs, charts, and tables but do not have any graphic designer friends ready to give you a helping hand. But if you are going to go this route, make sure that you do it well.
Ensure that the size of your text is easy to read, and make sure to choose fonts that are appropriate for the type of data that you are planning to present.
—
While these are not the only ways to engage your audiences by using great visuals, these tips and tricks should be enough to give you a good head start. To constantly keep people engaged, though, you will have to make sure that you keep yourself updated on all the latest research and studies on what really grabs people’s attentions.
Do not be afraid to experiment, either, as being different from your competition can be what makes you unique in your audience’s eyes. With enough determination, you will be able to master the art of visual storytelling, hooking potential clients, customers, and business partners no matter where you go.